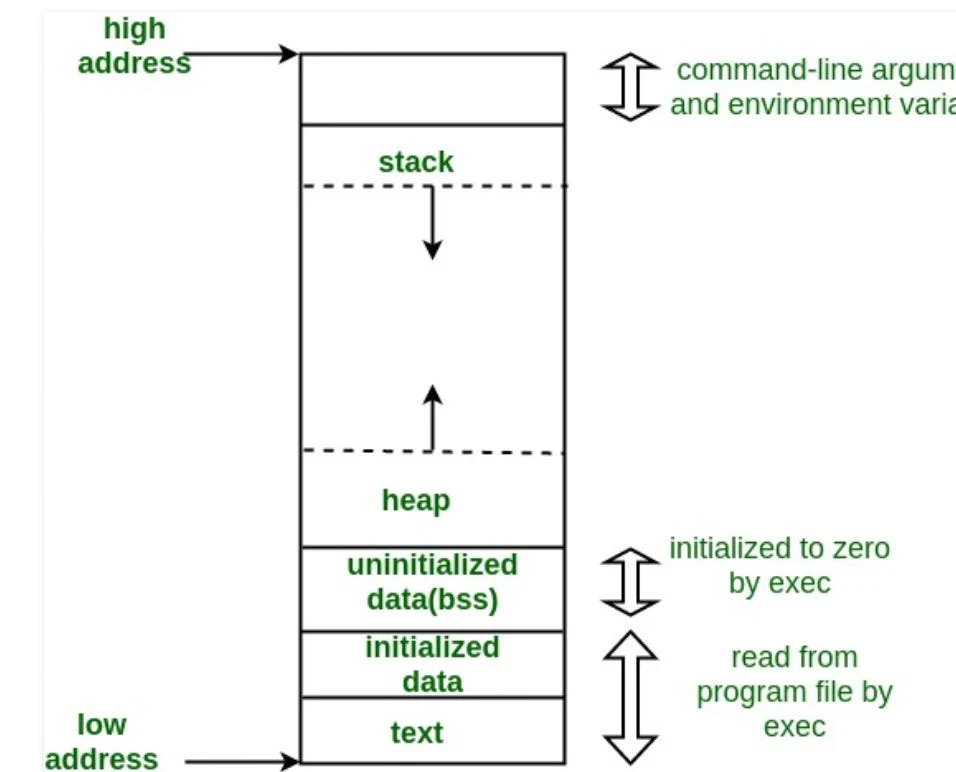
Hi, it’s my first blog. Please clap.
I’ve been playing around with memory in C++ lately, which is a fun way of saying I crashed my program a lot and got mad at a variable that doesn’t have feelings.
Not just using new and delete like a normal person. I wanted to know what they actually do underneath. Turns out, quite a lot. Turns out also, my computer has been quietly lying to me this whole time. More on that in a bit.
Where it started
I read some of the usual stuff first. Blog posts. Docs. A couple of CppCon talks:
- How to Write a Custom Allocator — Bob Steagall, CppCon 2017
- An Allocator is a Handle to a Heap — Arthur O’Dwyer, CppCon 2018
- How to Write a Heap Memory Profiler — Milian Wolff, CppCon 2019
All of it made sense on paper. Stack good, fast, small. Heap flexible, slower, manual cleanup. Cool story.
But I wanted proof. Not analogies. Actual proof that these two things exist as separate places in memory, right now.
So I wrote something :
#include <iostream>
using namespace std;

int main() {
    // 1. Put some stuff on the Heap so we can see it
    int* massiveArray = new int[50000];

    // 2. Put some stuff on the Stack
    int localNumber = 99;
    // 3. The Trap: The program will freeze here waiting for you to type
    int freeze;
    cin >> freeze;

    // Clean up
    delete[] massiveArray;
    return 0;
}
The trick is that cin >> freeze line. It freezes the program mid-run, on purpose. That gives me a window to go poke at the process while it’s still alive, instead of it finishing in a blink. (gemini told me)
I ran it, and while it sat there waiting, I opened VMMap (a free tool from Sysinternals) and attached it to the running process.
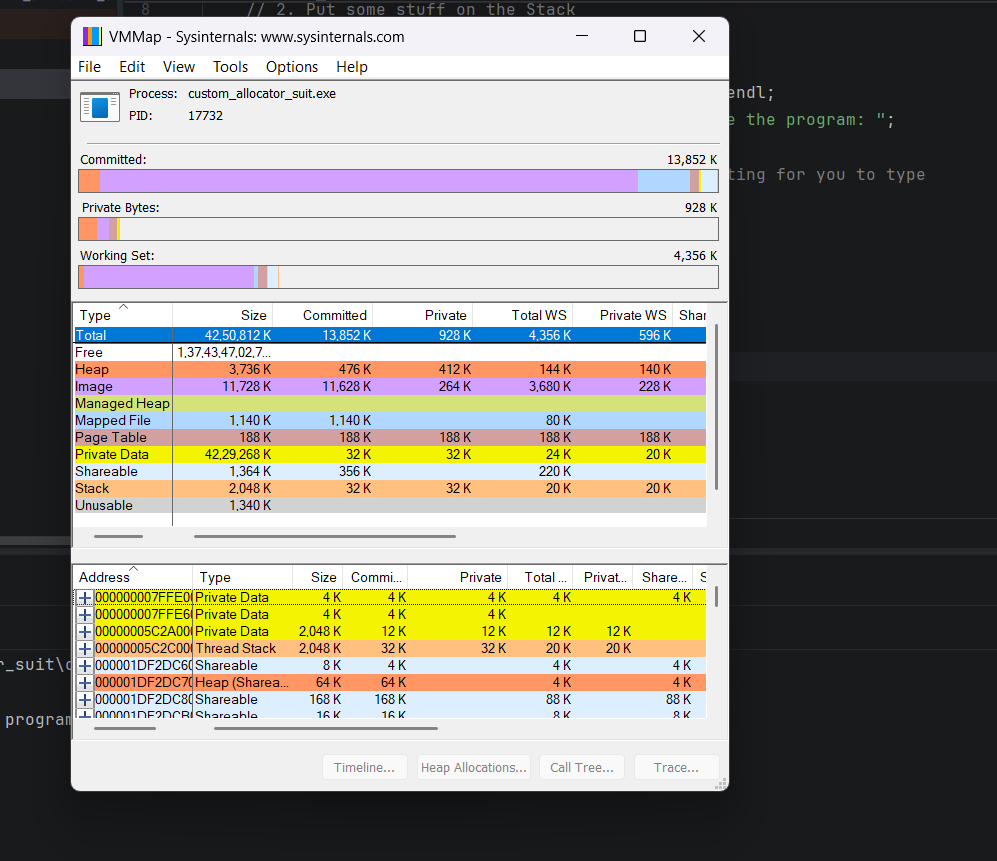
What VMMap actually showed me
This is the exact physical layout of the address space Windows built for this one program. Here’s what stood out.
The free space is enormous.
There’s a row labeled Free, sitting at roughly 128 terabytes. My machine does not have 128 TB of RAM. Nowhere close. This is virtual memory, laid bare. The OS hands every program a huge, clean, fake blueprint (or atleast that’s what I think)..
The heap is small, on purpose.
I asked for new int[50000]. That’s 50,000 integers. The heap section in VMMap was only around 3.7 MB. The OS didn’t round up to something huge. It gave me close to exactly what I asked for, no more.
The stack has a hard ceiling. The stack section showed 2,048 KB. Exactly 2 MB. Fixed. That’s the whole budget for local variables and every nested function call on that thread. Blow through it, and the program dies with a stack overflow.
Reserved and used are two different things.
The stack’s Size column said 2,048 KB. The Committed column right next to it said 32 KB. Windows reserved 2 MB but only actually wired up 32 KB of real RAM behind it. My program only used one small local variable, so that’s all it got. The rest of that 2 MB is not a fact, until something actually needs it.
Every address is right there.
Scroll to the bottom table and there’s a line for Thread Stack, with a real hex address next to it, something like 00000005C2C00.... That’s the literal top of the stack for that thread. It’s a real number, on a real running process, on my machine.
Okay, but what’s actually going on
VMMap shows the result. So here’s the mechanism, as I understand it now.
Registers, quickly
A register is a storage slot on the CPU chip itself. Not RAM. On the chip. There are very few of them, and each holds one number, usually 64 bits.
They’re fast because there’s no travel time. No bus, no memory controller, nothing external. Reading a register is about as close to instant as computing gets.
x86-64 has 16 general-purpose registers. A few have jobs by convention:
rax— holds return values.rbx— general-purpose, often kept safe across calls.rcx,rdx— general-purpose, also used for arguments.rsi,rdi— also used for arguments. Old names, from string-copy instructions decades ago.rsp— the stack pointer. Always points at the top of the stack.rbp— the base pointer. A fixed anchor inside the current function.r8–r15— added when x86 went 64-bit. General-purpose, plus two more argument slots.rip— instruction pointer. The address of what runs next.rflags— status bits, set after comparisons and math. This is whatifand loops read to decide where to jump.
On Linux and macOS, function arguments go into rdi, rsi, rdx, rcx, r8, r9, in that order, for the first six. Anything past six spills onto the stack. The return value comes back in rax. That’s why your function with more than six arguements is slow, jokes on you!
There’s also a split between registers a function can freely trash (rax, rcx, rdx, rsi, rdi, r8–r11) and ones it has to save and restore if it touches them (rbx, rbp, r12–r15, rsp). That split is the only reason two functions, written by two different people, can call each other without stepping on each other’s data.
The stack, precisely
The stack is a region of memory managed by one register: rsp.
It only grows and shrinks from one end. (LIFO) Last thing added, first thing removed. Because of that rule, nothing needs bookkeeping. rsp always knows exactly where the top is.
Growing it means subtracting from rsp. Shrinking it means adding back. One instruction. sub rsp, 32. That’s the entire cost.
int square(int x) {
    int result = x * x;   // lives on the stack
    return result;
}

int main() {
    int value = square(6);
    return 0;
}
Here’s what actually happens when square(6) runs:
6goes intordi.call squarepushes the return address, then jumps.- Prologue:
push rbp,mov rbp, rsp,sub rsp, 16. resultlands at[rbp - 4].- The answer moves into
rax. - Epilogue:
mov rsp, rbp,pop rbp,ret.
(you can see this yourself deassembling your code)
The second square returns, that slot is done. The bits might still physically sit there for a while, but rsp has already moved past them. The program won’t touch that memory as valid again. This is exactly why returning a pointer to a local variable breaks — the address is real, the lease on it just expired.
On Linux, the default per-thread stack is usually 8 MB. My VMMap screenshot showed 2 MB, since that’s the Windows default. Either way, past that limit sits a guard page — memory deliberately left unmapped, so overflowing the stack crashes cleanly instead of quietly corrupting whatever’s next door.
rbp, precisely
rsp keeps moving during a function. rbp doesn’t. It gets set once, at the top of the function, and stays put. Every local variable is then just “so many bytes from rbp,” a number that never has to change mid-function.
When a function calls another, the callee saves the caller’s rbp, sets up its own, and restores the old one before returning. That creates a chain — each saved rbp points back to the one before it, with a return address sitting right above it. Follow that chain, and you’ve rebuilt the entire call history. That’s exactly how debuggers print stack traces.
One catch: optimized builds often skip this (-fomit-frame-pointer, default at higher optimization levels) and track everything from rsp directly at compile time. rbp becomes just another free register. That’s why release-build stack traces sometimes look broken — the chain simply isn’t there anymore.
The heap, precisely
No register owns the heap. No dedicated instruction. It’s entirely software — malloc in C, called internally by new in C++ — sitting on top of the OS.
The library gets memory from the kernel through two paths:
brk/sbrk— moves a single break pointer to extend one region. Older, used for smaller requests.mmap— asks for a fresh separate region. Used for bigger requests, past roughly 128 KB by default in glibc.
Neither of those hands you physical RAM right away. They reserve address space and mark it valid in the page tables. Actual RAM only gets attached the first time you touch that memory — a page fault fires, the kernel finds a free physical page, zeroes it, and wires it in. This is exactly why Committed was so much lower than Size in my VMMap screenshot. Reserved isn’t the same as real.
On top of that, the allocator keeps its own records. Every chunk it hands out carries a small hidden header just before your pointer, noting its size. Free chunks get sorted into size buckets so searching is fast. When something is freed, neighboring free chunks get merged, to fight fragmentation.
All that searching, merging, and bookkeeping is why heap allocation costs more than stack allocation. If you want to know how it works, there is something called Bit Scan Forward. I don’t know in details tho. In multi-threaded programs it costs even more, since the heap is usually shared across threads and needs locking. The stack needs none of that — each thread already owns its own.
#include <iostream>

struct Player {
    int hp;
    char name[32];
};

int main() {
    Player* p = new Player{100, "test"};
    std::cout << p->name << " has " << p->hp << " hp\n";
    delete p;
}
new does two things: calls operator new (which calls malloc, and throws instead of returning null on failure), then runs the constructor. delete reverses it — destructor first, deallocation second. Forget delete, and that memory never comes back. The stack cleans itself up automatically. The heap just sits there, unfreed, holding a grudge.
Fragmentation
Only a heap problem, since the stack’s strict order makes it impossible there.
- External — enough free memory total, just not in one big enough piece.
- Internal — the allocator hands back more than you asked for, due to minimum sizes or alignment, and the extra is wasted.
Why any of this matters
- Deep recursion or a giant local array overflows the stack. A big
std::vectorusually doesn’t, because its actual data lives on the heap. Only the small vector object sits on the stack. - Returning a pointer to a local variable is broken, even when it compiles and even when it seems to work once.
- Custom allocators beat general-purpose ones for narrow use cases, because they skip all the bookkeeping a general allocator has to carry for every possible case.
The toolkit
Here’s what I actually used, split by platform.
Linux, macOS, or WSL:
# Disassemble the binary — look for push rbp / mov rbp, rsp / sub rsp, N
objdump -d your_program

# Live memory map of a running process
cat /proc/self/maps
cat /proc/<pid>/maps

# Watch the program ask the OS for memory, live
strace -e trace=mmap,brk ./your_program

# Step through and watch registers move
gdb ./your_program
(gdb) break square
(gdb) run
(gdb) print $rsp
(gdb) print $rbp
(gdb) info registers
Windows, no WSL:
# VMMap (Sysinternals) — the tool behind this whole post
# Run VMMap.exe, attach to your process, read the middle and bottom tables

# Process Explorer (Sysinternals) — live view of a running process
# Same suite, run procexp.exe

# x64dbg — free debugger, step through assembly, watch every register live
# Open your .exe, set a breakpoint, F9 to run, F8 to step

# Already on Visual Studio? Nothing extra to install:
# Debug -> Windows -> Disassembly
# Debug -> Windows -> Registers
None of this is required to understand the theory. But I had to write a blog, so you better read it (Implicit threat).
Closing
If I got something wrong here, tell me.